Our Role
CUSTOM WEB DEVELOPMENT | INTERACTIVE DESIGN | GRAPHIC DESIGN
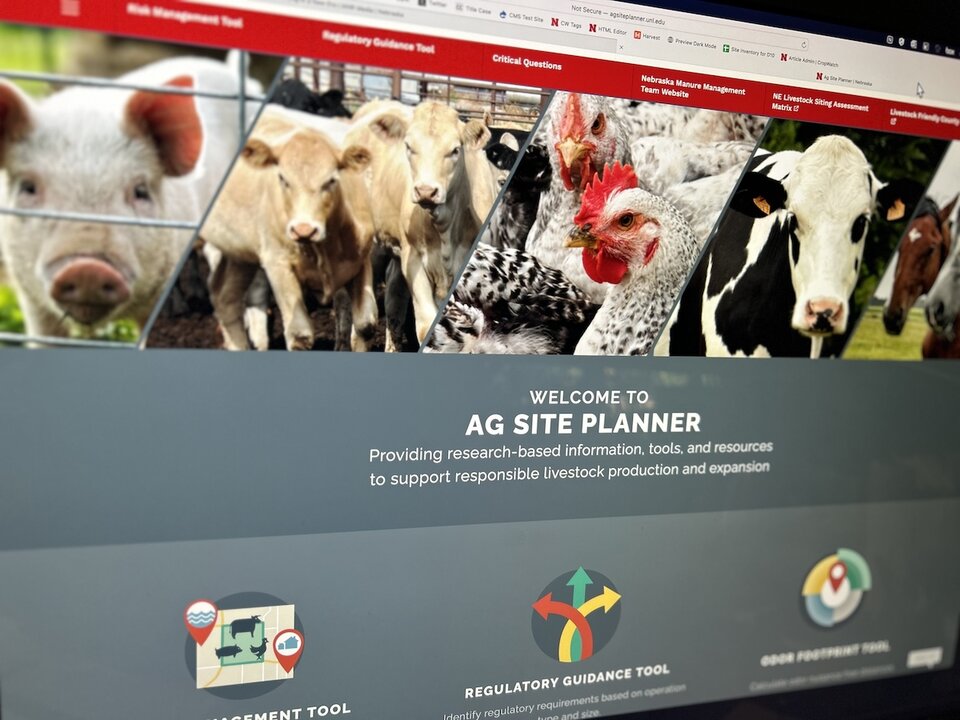
Ag Site Planner provides research-based information, tools, and resources to support responsible livestock production and expansion.
This website was developed to help livestock producers understand and navigate the various practical and regulatory issues that come with expanding or establishing a new livestock feeding operation.
Ag Site Planner consists of three tools as well as links to useful related resources. The Risk Management Tool allows a producer to identify on a map the location they are considering for adding or expanding their operation, add additional details related to the type of livestock, kind of operation and size, and return key information specific to that location that help them determine if it is their best option for siting their operation. The Regulatory Guidance Tool helps a producer understand how their potential operation will be classified and directs them to their local county authorities for details. The Odor Footprint Tool allows a producer to visualize on a map how the potential odor from their specific operation might impact the surrounding area.
Ag Site Planner was created by the faculty at the University of Nebraska-Lincoln that specialize in the issues realted to manure management at livestock feeding operations. IANR Media developed this custom website based on their research and knowledge of the subject matter and these tools are used across Nebraska by producers, government representatives, and industry professionals.

Custom Icon Designs
Example Features
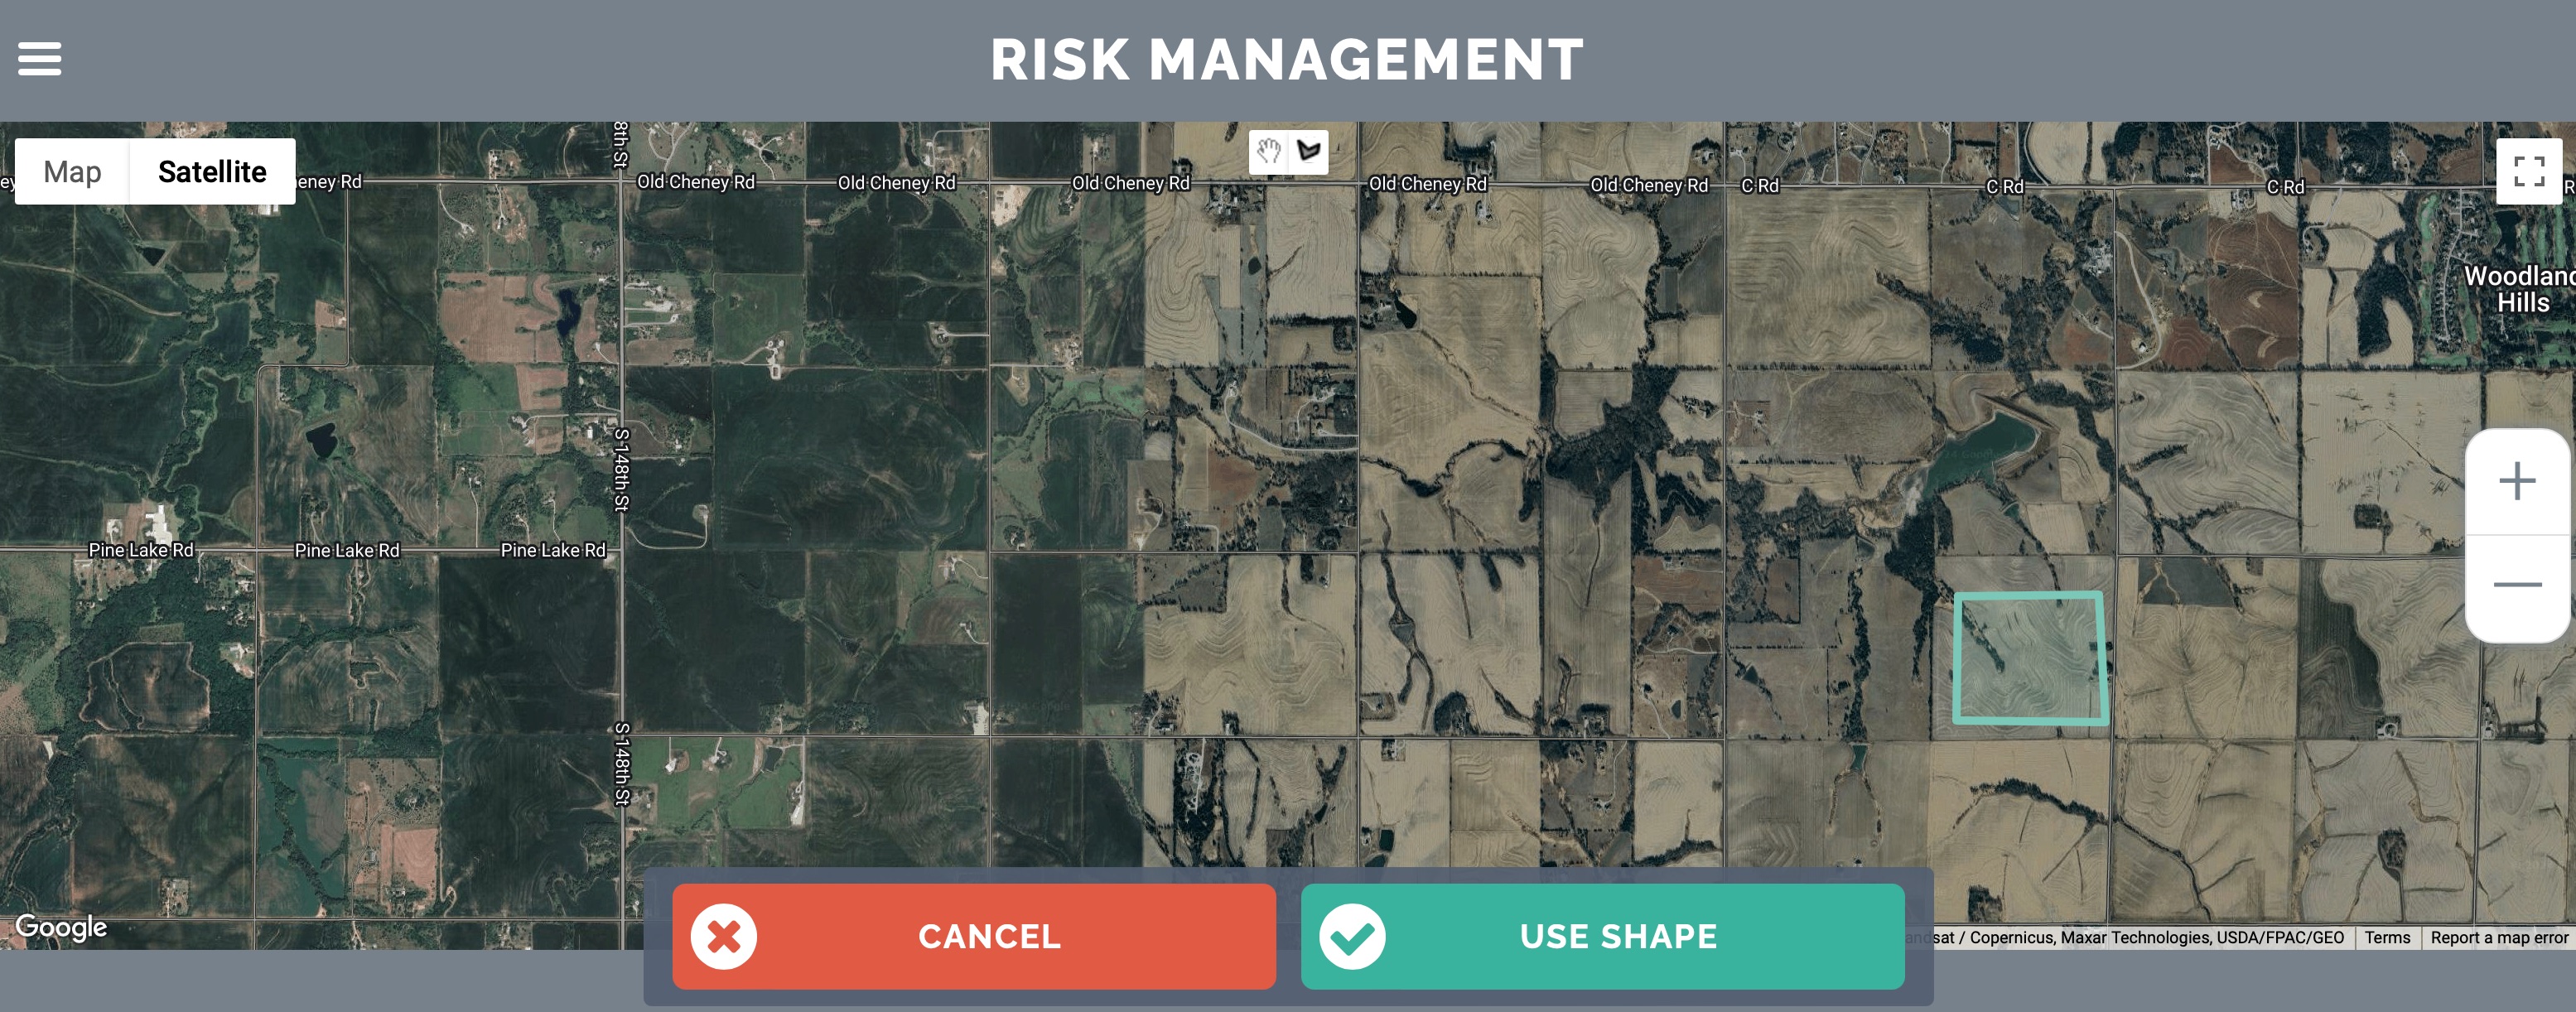
Map Selector Integration
IANR Media developed a custom map integration that allows livestock producers to select a precise location/shape on the map where they are thinking bout locating a new livestock opearation.

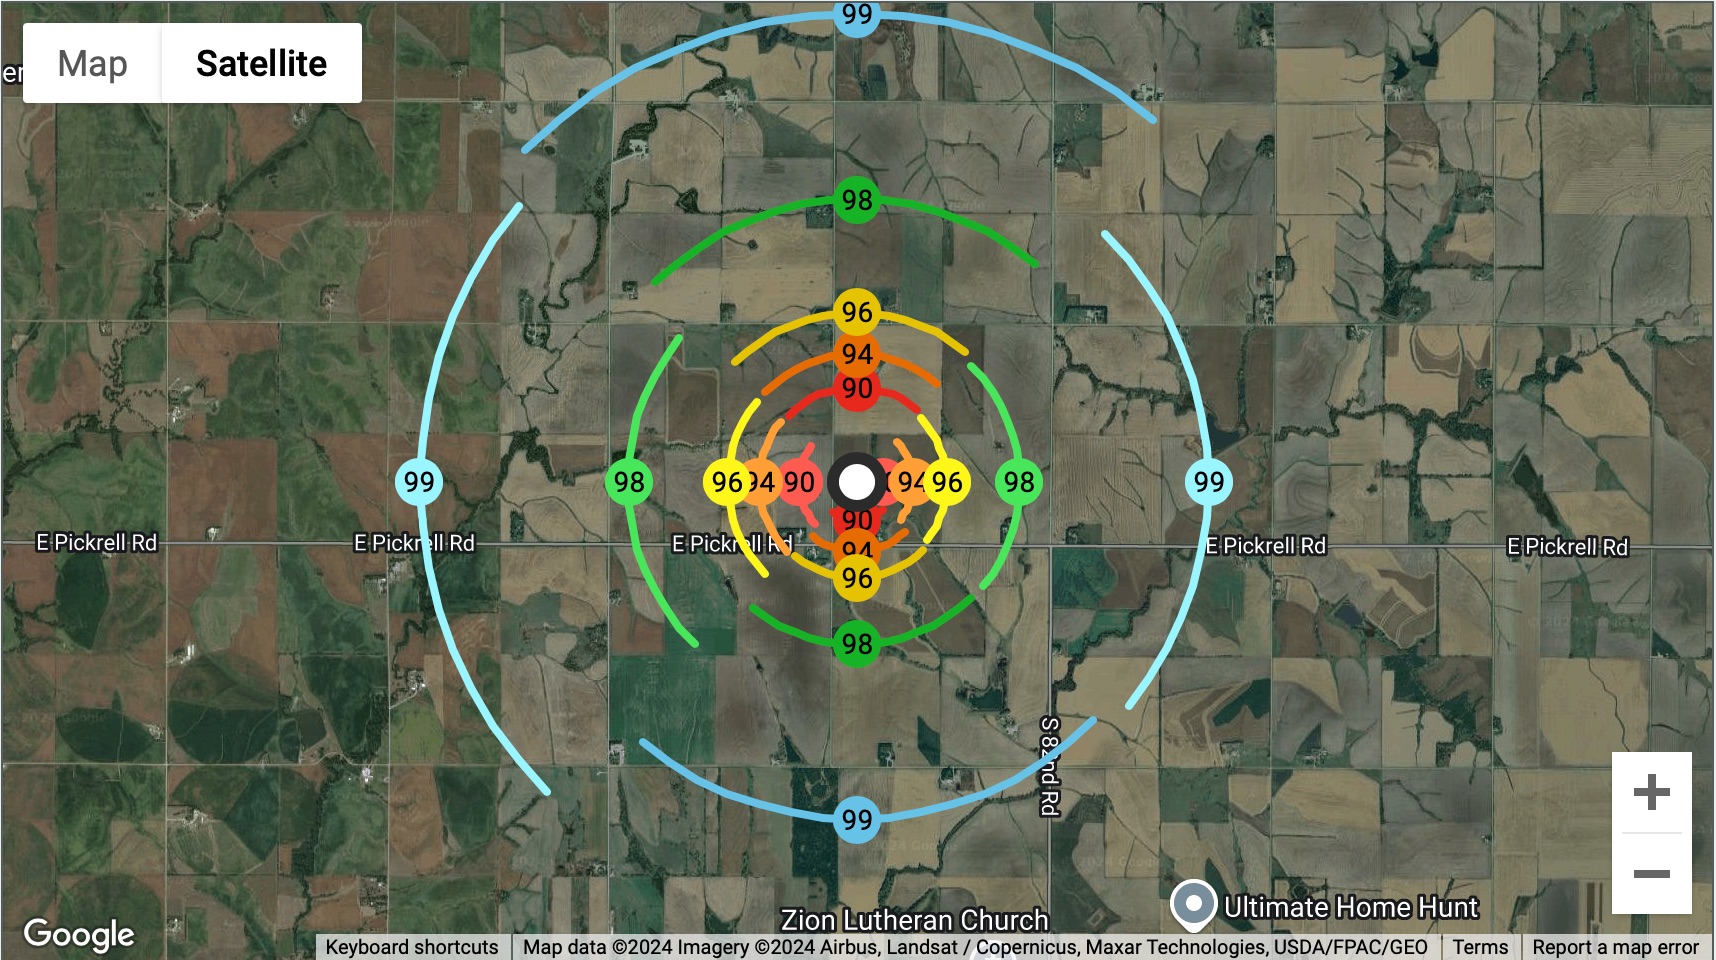
Dynamically Generated Map Visualizations
The Odor Footprint Tool was built to allow a producer to input specific information about their operation and generate a map visualization showing the overall odor footprint of their planned operation based on University research. Similar map visualizations are used throughout the Risk Management Tool as well.

